How is the industry tracking in the ESG transition?

ESG Futures update
Climate change is one of the most urgent issues of our time. Discussions on how to support and accelerate the green transition are critical and as Optiver we believe it’s important to play an active role in this. Our approach is two-fold. Firstly, to help build trust in the ESG category and ultimately accelerate the ESG transition, we are actively sharing our knowledge and expertise of capital markets in the ESG discussion. Secondly, we are contributing to the ESG transition through our core business of liquidity provision.
When it comes to liquidity provision in ESG derivatives, we expect the ESG versions of derivatives to eventually replace their original benchmarks. In the future, ESG products will not be viewed as a separate product/class, but simply another dimension of investment criterion. With this vision in mind, we published a paper in December 2020 (in which we conducted an ESG “pulse-check” and where we compared the relative adoption of ESG futures in both European and American capital markets.
With the first quarter of 2021 almost behind us, this paper is an update with the latest data of the original analyses focused on the relative performance of ESG derivatives vs their benchmark products in both Europe and the US.
EU PERFORMANCE VS US
Europe prides itself on being ahead in the ESG transition globally. To check if this is reflected in the capital markets, we assessed the market share of the most traded ESG future (ESG-X on Eurex and the S&P ESG future listed on CME) vs the traditional benchmark product in both Europe and the US. Our conclusion in December was that Europe is indeed ahead in terms of market share of notional traded in the ESG future but that, relative market shares vs traditional benchmark products were still relatively small and it was not obvious from the previous analysis that these were growing over time.
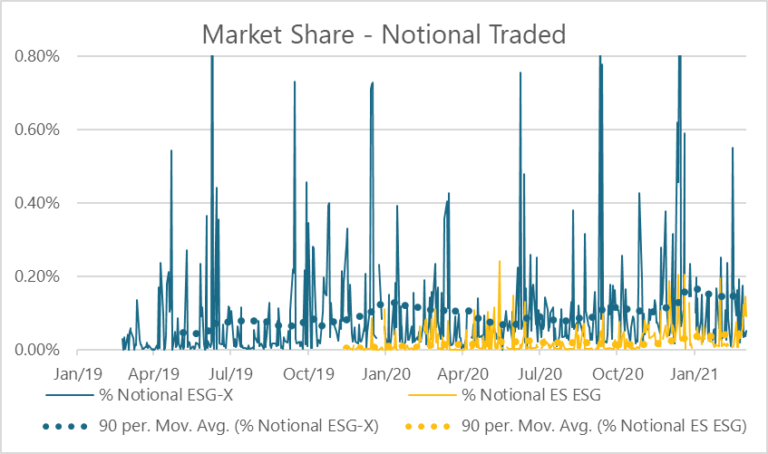
In this graph we take the notional traded, which is defined as lots traded* underlying value, of the main ESG future in both regions and divide that by the notional value of the corresponding benchmark future. The dotted line is the 90-day moving average of this data and is included in the graph to show the longer term trend.
The latest data offers some room for optimism. There’s an upward trend in terms of ESG market share emerging since our latest report in both Europe and the US (although it is worth noting that the market share of the ESG futures is still relatively low).
In the last report we argued that ESG products, given that we are still in the relatively early phase of development, should not be viewed as “trading” products, but that they’re better assessed as “buy and hold” products. Instead of market share, a better metric to measure this is to review the development of open interest of the ESG future vs the benchmark over time:
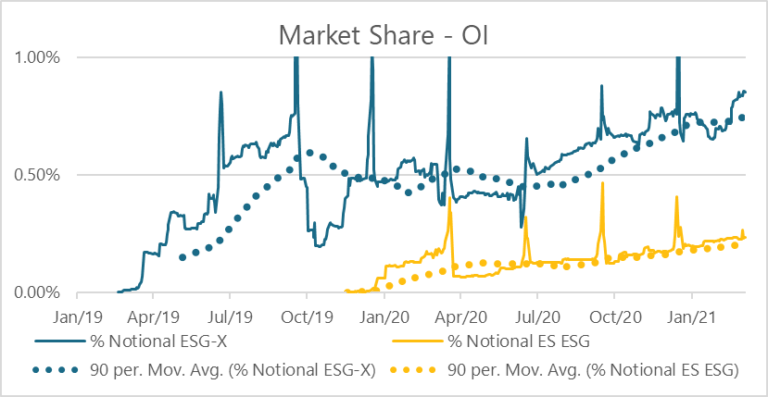
In this graph we take the open interest (OI), which is defined as the total number of outstanding contracts that are held by market participants at the end of each day, of the main ESG future in both regions and divide that by the open interest of the corresponding benchmark future. The dotted line is the 90-day moving average of this data and is included in the graph to show the longer term trend.
Similar to the results in the last report the market share of open interest in the ESG futures in Europe is higher compared to the US, although both are still relatively small. What’s positive is that the open interest market share continues to grow in the ESG products in both regions. We also see (excluding blips around roll periods) open interest in both Europe and US back at the highs touched before the pandemic roiled markets and induced a flight to traditional assets.
In this report we thought it would also be useful to include data on developments in ESG option products as these have been recently introduced in the US (S&P 500 ESG options on CBOE) and have been listed for some years already in Europe (Stoxx 600 ESG-X options on Eurex). However, volumes in these products are still minimal, with most activity coming from a handful of large off-screen block trades that happen throughout the year. Given that, we will not include any data on these products now, but rather monitor the space and include ESG options data in our report once the interest in these products picks up. We do note that the frequency of larger block trades seems to be increasing, with SPX ESG options printing the first major trade in February. This is an encouraging sign for the institutional take-up of ESG-tracking options products.
CONCLUSION
Based on the latest data we can draw a few conclusions:
- The relative performance in terms of market share in notional value and open interest of the main ESG future in Europe vs the benchmark, is still stronger than in the US. Differences between the two regions remain roughly constant.
- The market share in notional value and open interest in the most traded ESG futures is gradually increasing over time in both regions, supporting the view that ESG benchmarks will grow to become the standard in the future.
- The market share of notional value and open interest of the ESG futures is still relatively small compared to the benchmark in both regions.
- The ESG-related options market is still in its infancy but is showing initial signs of industry take-up.
In summary, it can be concluded that there’s progress to be found in supporting the ESG transition through capital markets, but there is also still plenty of room for further growing and developing the ESG derivatives space. To accelerate change, we need to continue the dialogue as an industry, but also put our words into action and consider that it’s more important to keep taking steps in the right direction than for every step to be 100% right. This means for exchanges to launch ESG products with competitive fee and rebate schemes, based on end-investor demand and for market makers, including Optiver, to support these products through liquidity provision and building trust in the market.
About Optiver
Over thirty five years ago, Optiver started business as a single trader on the floor of Amsterdam’s European Options Exchange. Today, we are a leading technology-driven market maker, with more than 1000 employees in offices around the world, united in our commitment to improve the market by competitive pricing, execution and thorough risk management. By providing liquidity on multiple exchanges across the world in various financial instruments we participate in the safeguarding of healthy and efficient markets.
We provide liquidity to financial markets using our own capital, at our own risk, trading a wide range of products: listed derivatives, cash equities, ETFs, bonds and foreign currencies.
DISCLAIMER: Optiver V.O.F. or “Optiver” is a market maker licensed by the Dutch authority for the financial markets to conduct the investment activity of dealing on own account. This communication and all information contained herein does not constitute investment advice, investment research, financial analysis, or constitute any activity other than dealing on own account.